A Complete Step-by-Step Workflow: From Triage Image or Memory Dump → CSV Timelines → Elastic SIEM for Scalable Analysis
Disclaimer
This guide is purely for educational and personal reference. It walks you through the exact workflow I use to turn any triage image or memory dump into clean CSV timelines and ingest them into Elastic SIEM for fast, scalable analysis.
Tools You’ll Need
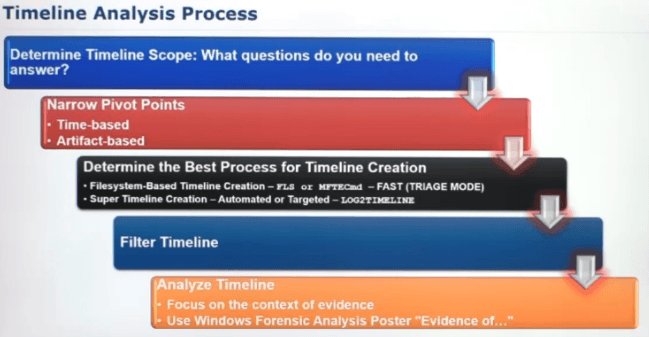
What Is a Super Timeline?

A Super Timeline is the process of converting disk artifacts (e.g., FTK, KAPE) or memory artifacts (e.g., Volatility 2, MemProcFS) into clean CSV files. These files can be directly ingested into a SIEM or used for manual analysis. This approach provides a unified, searchable timeline, eliminating the need to switch between tools. It enables better collaboration within your team, as multiple analysts can contribute to the analysis, rather than relying on a single analyst running the tool.
The Workflow
- Gather Artifacts (Disk/Memory images)
- Process Artifacts to extract revelant items.
- Generate CSV timeline(s) — choose any (or all) of the three methods below
- Ingest the CSV(s) into Elastic SIEM
If you havent already captured the images here is my writeup outlining collection of the artifacts.
Windows Artifact CollectionAnalysis Steps
Step 1 - Pick your Timeline
Options A-C : Generate Your CSV Timelines (Choose Any or All)
Option A - Disk Triage Image Timeline
You only need one method to get usable CSVs, but many analysts run all three for maximum coverage.
Disk Timeline with Plaso (Recommended for speed)
Why a triage image and not a full image? Plaso works on both, but a full image takes substantially longer to process. A refined triage image (collected with KAPE) gives you a short kill chain for analysis and far less noise for the analyst to filter through. Below is a captured triage image in .vdhx format.

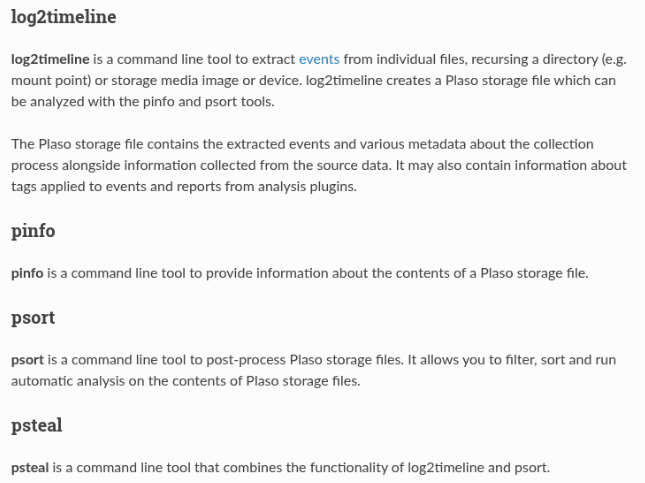
Next well use the Plaso tools suite to process this image into a workable csv: log2timeline (extracts events), pinfo (info about the storage file), psort (post-process), and psteal (combines log2timeline + psort into one easy command).
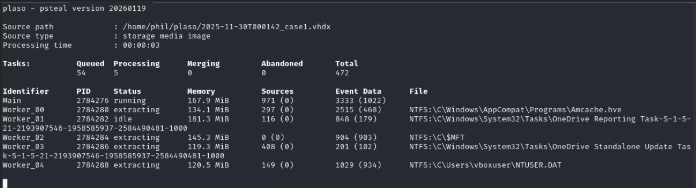
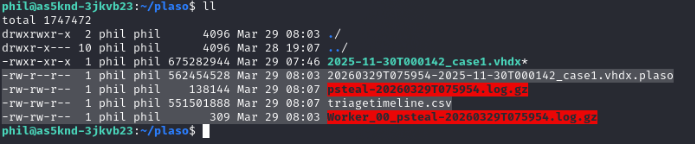
Here we use psteal.py as the all in one tool to process image.
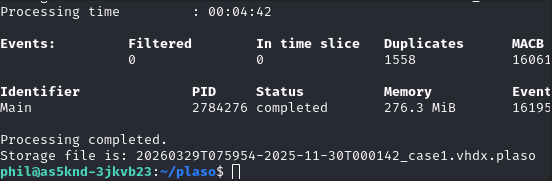
psteal.py --source 2025-11-30T000142_case1.vhdx --output-format csv --output triagetimeline.csvProcessing time on a triage image: ~5 minutes. You’ll get a clean CSV ready for Elastic.
Option B: Memory Timeline with Volatility 2
Now lets change it up for a memory image. We can also process a memory image into a timeine for analysis. First we use volatility2, always run windows.info plugin to confirm the profile
and system details.
┌──(vol2env)─(john㉿system32)-[~/Documents/tools/volatility]
    └─$ python2 vol.py -f /home/john/Documents/tools/samples/solarmarker.img kdbgscan
    Volatility Foundation Volatility Framework 2.6.1
    **************************************************
    Instantiating KDBG using: Kernel AS Win10x64_14393 (6.4.14393 64bit)
    Offset (V)                    : 0xf802dd1bd4f0
    Offset (P)                    : 0x100bbd4f0
    KdCopyDataBlock (V)           : 0xf802dd07d91c
    Block encoded                 : No
    Wait never                    : 0x3f3c19400e62e7f0
    Wait always                   : 0xcc5c1651783f8001
    KDBG owner tag check          : True
    Profile suggestion (KDBGHeader): Win10x64_14393
    Version64                     : 0xf802dd1bfff0 (Major: 15, Minor: 15063)
    Service Pack (CmNtCSDVersion) : 0
    Build string (NtBuildLab)     : 15063.0.amd64fre.rs2_release.170
    PsActiveProcessHead           : 0xfffff802dd1cb000 (64 processes)
    PsLoadedModuleList            : 0xfffff802dd1d15a0 (186 modules)
    KernelBase                    : 0xfffff802dce85000 (Matches MZ: True)
    Major (OptionalHeader)        : 10
    Minor (OptionalHeader)        : 0
    KPCR                          : 0xfffff802dc0d9000 (CPU 0)
    KPCR                          : 0xffffe700e9176000 (CPU 1)

    **************************************************
Once we have profile we can then use the timeliner plugin to generate a body file from the memory image.
python2 vol.py -f memory.img --profile=Win10x64_14393 timeliner --output=body --output-file=vol2timeliner.bodyThen feed the bodyfile into log2timeline to create the .plaso file needed for psort to process:
log2timeline.py --parsers=bodyfile --status_view window --storage-file ./output.plaso vol2timeline.body
Once we have the .plaso file we can they use psort to parse into a csv.
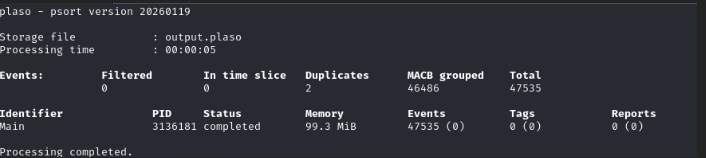
Lastly this gives us a workable format to input into SIEM or another analytical platform.
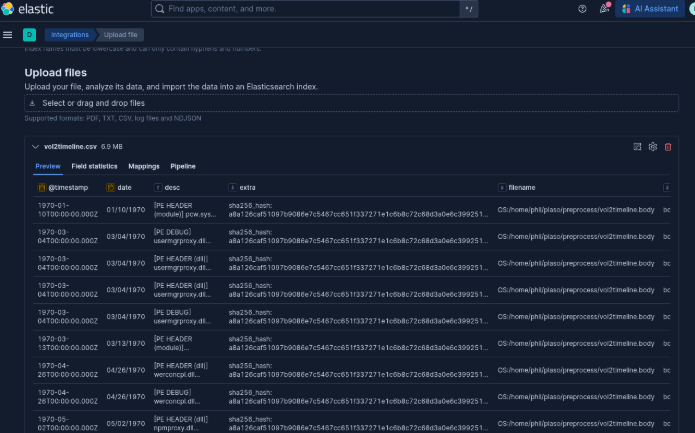
Option C: MemProcFS Timeline CSVs (Easiest for memory)
MemProcFS is a windows based tool the process memory images in a all in one go style. It mounts the memory dump as a normal drive (usually
M:) and instantly gives you pre-parsed CSV timelines
for every artifact type. We want to make sure when running the tool we specify the "-forensics" option so we get then additional processing to generate needed CSVs.
MemProcFS.exe -f memory.img -forensics 1 -license-accept-elastic-license-2.0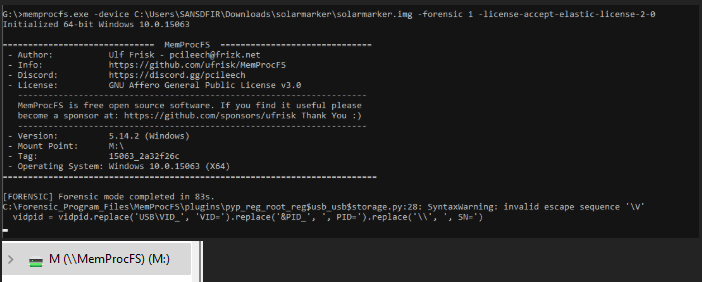
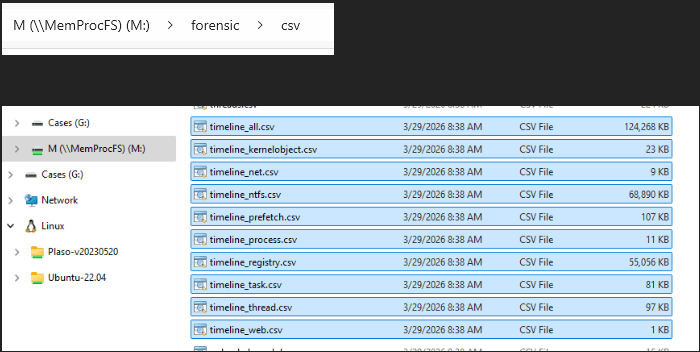
After it finishes, navigate to:
M:\forensics\csv\You’ll see many ready-to-use files:
timeline_all.csv— the most completetimeline_prefetch.csvtimeline_registry.csv-
timeline_process.csv,timeline_thread.csv, etc.
Step 2: Ingest into Elastic
Overview
So lets talk scale. Now that we have timelines we can use a tool like timeline explorer or even notepad++ to allow analyst to start digging into it for evidence. This is perfectly fine. A more scalable approach is to ingest this data into a SIEM for them to create filters and queries on. So in this step of the blog we will be going over ingesting these timelines into a SIEM.
First off we are going to use Elastic Search. If you haven’t stood up a SIEM or are looking to I have a blog on an easy setup for Elastic Search quick install SIEM here. https://18gi0n.org/webpages/homesiem.html.
Steps
Once you have your SIEM up there is a couple options you have to ingesting the data. We are only going to cover 3 here from easiest manual to more automated approaches for doing this at scale.
The fastest option without needing to setup any scripts or tooling is to use the data visualizer below with csvs straight from Kibana.
1. Data Visualizer
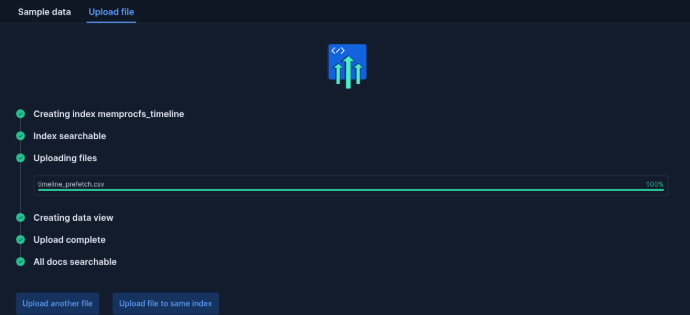
Once in Elastic and logged in you want to go to the home page here you will see an option to upload a file.
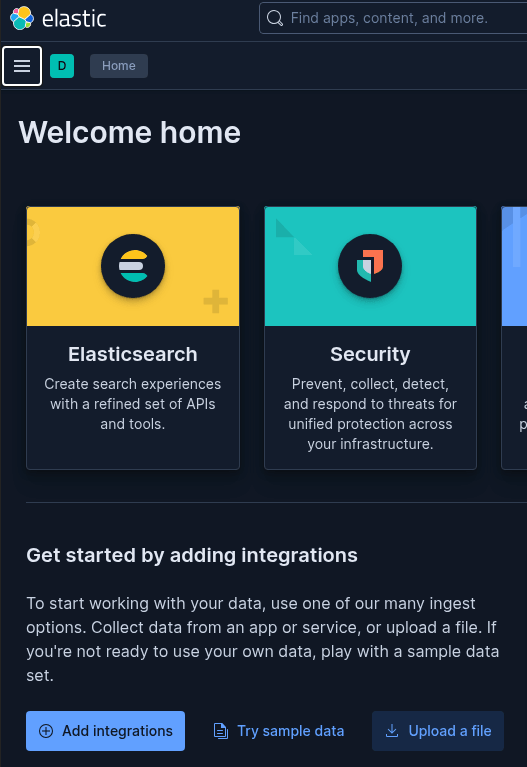
You want to click upload a file. Of note this is restricted to 1 GB file max size.
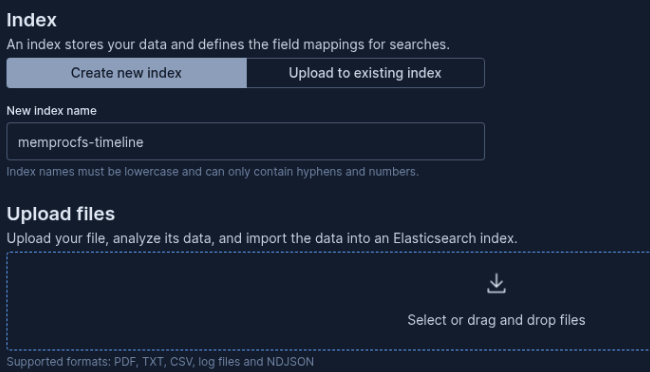
Here you are going to want to name your index and then select and upload file.
Now you might get an error if your admin hasn’t changed the max file size from 60mb. If so report to them and have them change in stack management-kibana-adv settings.
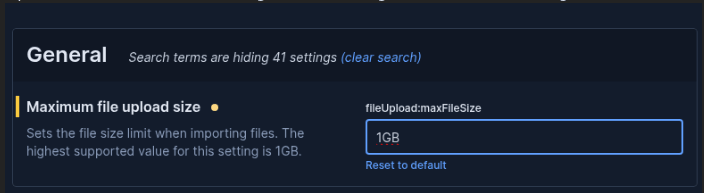
Then click through and import index. You can customize options here for parsing and datamapping but I’ll leave that to the individual use case.
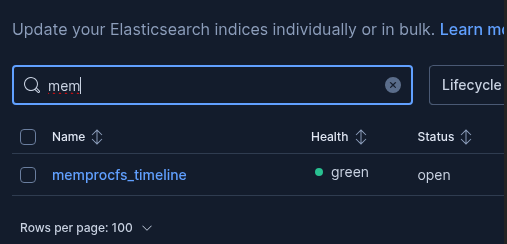
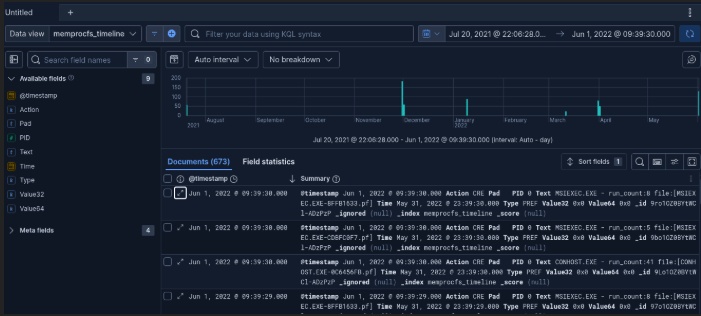
If we go to index management we can then see index and view in discover.
2. API POST (Bulk)
Now let’s say we want to automate this by collecting sample output to a dir and the auto ingest into SIEM all without user interaction. Let’s do this. We have two ways: one via api direct calls and one via elastic agent. First let look at direct calls.
Elastic will let you create an index via api call. This does require us to have the proper file formats. So first thing we want to do is convert the timelines csv to ndjson. Here is a script I had AI make to do so.
#!/usr/bin/env python3
    import csv
    import json
    import sys

    def csv_to_ndjson(csv_file_path, ndjson_file_path):
        """
        Converts a CSV file to NDJSON format for ingestion with helpers.bulk().
        Each line in the NDJSON is a document JSON object.
        Completely empty rows are skipped.
        """
        # Handle very large CSV fields
        import sys
        max_int = sys.maxsize
        while True:
            try:
                csv.field_size_limit(max_int)
                break
            except OverflowError:
                max_int = int(max_int / 10)

        with open(csv_file_path, mode='r', newline='', encoding='utf-8') as csv_file:
            reader = csv.DictReader(csv_file)

            with open(ndjson_file_path, mode='w', encoding='utf-8') as ndjson_file:
                for row in reader:
                    # Skip empty rows
                    if not any(row.values()):
                        continue

                    # Write only the document line
                    ndjson_file.write(json.dumps(row) + '\n')

        print(f"Conversion complete! NDJSON saved to: {ndjson_file_path}")

    if __name__ == "__main__":
        if len(sys.argv) != 3:
            print("Usage: python csv2ndjson.py input.csv output.ndjson")
            sys.exit(1)

        csv_path = sys.argv[1]
        ndjson_path = sys.argv[2]

        csv_to_ndjson(csv_path, ndjson_path)
To run it use the command syntax like this:
python3 csv2ndjson.py "csv location" "outputfile" "indexname"Once we have the script we can then make a post to api to write index.

curl -X POST -H "Authorization: ApiKey $APIKEY" -H "Content-Type: application/x-ndjson" -d @triage.ndjson "http://192.168.1.2:9200/_bulk"Note that Elasticsearch limits the maximum size of a HTTP request to 100mb by default so clients must ensure that no request exceeds this size. If you do have files larger than that limit you can use the below Lage file script.
Before you run the Large File script you are going to want to prepare environment to run the script.
# Step 1: create a virtual environment
    python3 -m venv ~/plaso/venv

    # Step 2: activate the virtual environment
    source ~/plaso/venv/bin/activate

    # Step 3: upgrade pip inside the venv
    pip install --upgrade pip

    # Step 4: install Elasticsearch client
    pip install elasticsearch
Once dependicies and environment is setup we can use this python script I had AI create to bulk index a large file.
#!/usr/bin/env python3
    import json
    import argparse
    from elasticsearch import Elasticsearch, helpers

    # -----------------------------
    # Static configuration
    # -----------------------------
    ES_HOST = "http://localhost:9200"
    API_KEY = "$APIKEY$"
    BATCH_SIZE = 5000
    # -----------------------------

    def bulk_ingest_large_file(file_path, index_name):
        """
        Reads a large NDJSON or JSON file and ingests it into Elasticsearch in batches.
        Only file_path and index_name are dynamic.
        """
        # Connect to Elasticsearch
        es = Elasticsearch(hosts=[ES_HOST], api_key=API_KEY)

        actions = []
        line_count = 0

        with open(file_path, "r", encoding="utf-8") as f:
            first_char = f.read(1)
            f.seek(0)

            if first_char == '[':
                # JSON array
                data = json.load(f)
                for doc in data:
                    actions.append({"_index": index_name, "_source": doc})
                    line_count += 1

                    if len(actions) >= BATCH_SIZE:
                        helpers.bulk(es, actions)
                        actions = []
            else:
                # NDJSON
                for line in f:
                    line = line.strip()
                    if not line:
                        continue
                    doc = json.loads(line)
                    actions.append({"_index": index_name, "_source": doc})
                    line_count += 1

                    if len(actions) >= BATCH_SIZE:
                        helpers.bulk(es, actions)
                        actions = []

        # Send any remaining documents
        if actions:
            helpers.bulk(es, actions)

        print(f"Ingested {line_count} documents into index '{index_name}' successfully.")

    def parse_args():
        parser = argparse.ArgumentParser(description="Bulk ingest large JSON/NDJSON into Elasticsearch")
        parser.add_argument("file", help="Path to NDJSON or JSON file")
        parser.add_argument("index", help="Elasticsearch index name")
        return parser.parse_args()

    if __name__ == "__main__":
        args = parse_args()
bulk_ingest_large_file(file_path=args.file, index_name=args.index)- Script takes file path + index name as inputs.
- Connects to Elasticsearch using hardcoded host + API key.
- Reads file line by line (NDJSON or JSON array).
- Collects documents into batches (
BATCH_SIZE). - Sends each batch to Elasticsearch via
helpers.bulk(). - Sends any remaining docs after last batch.
- Prints total documents ingested and target index.
The syntax to run it is as below:
python3 elkbulkingest2.py "file" "desiredindexname"Once Complete you will see this output.

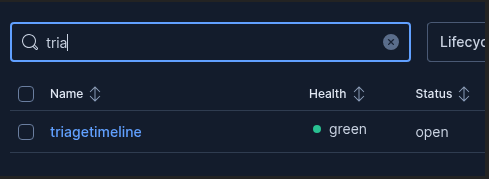
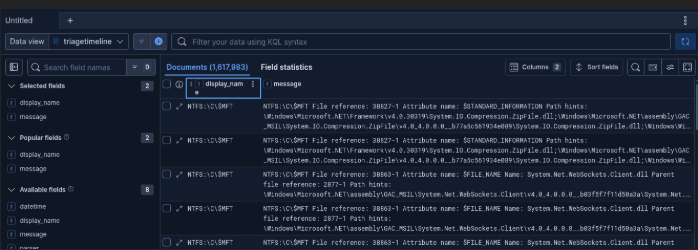
They to verify you can go to Stack management - index management and search for index name and open in discover to verify you data.
3. Elastic Agent Filestream
Another option we have is with Elastic Agent. This is not the most ideal since it’s meant for a file stream input from file being written to over time where our files are static but it can still be used.
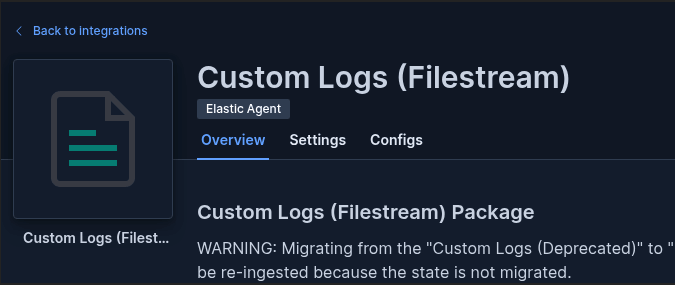
Here we want to enroll an agent in Fleet and add the custom file stream integration to the agent policy with desired agent.
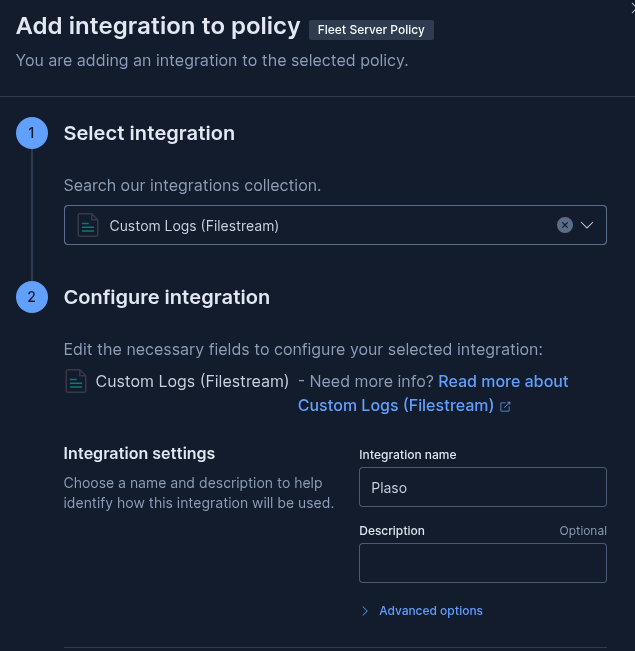
We are going to add integration to desired policy.
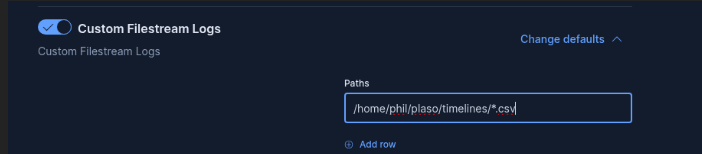
Inside the integration we want to specify the directory the files we are going to be ingesting (timelines) live in.
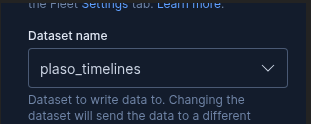
Also for organization sake give the dataset name a distinct name to help id indexes.
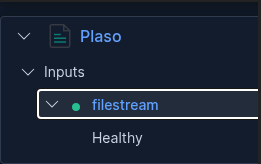
Click and deploy new policy. Then after agent is healthy and integration is showing healthy.
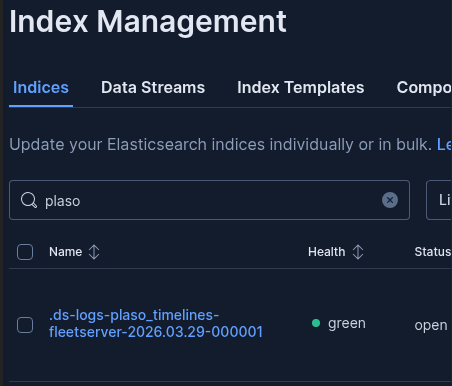
Go to stack management → index management and look for index by search plaso.
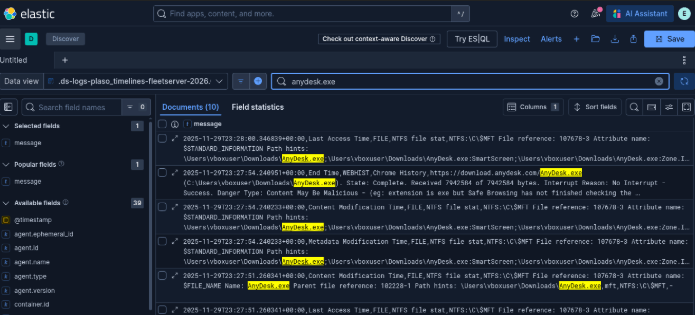
If we click and explore in discover we can see all events in the message field. This can be parsed to your teams liking but from here we can do searches on the data at mass.
Key notes here is now going forward any timelines you put in that directory will be ingested into Elastic via this pipeline we just setup.
Closing Thoughts
That’s the complete Super Timeline workflow. Generate your CSV(s) using whichever method fits your case (Plaso, Volatility 2, or MemProcFS), then ingest into Elastic SIEM. From there you have a fast, scalable, searchable timeline ready for analysis.
Forensics Blog Collection
Quickly navigate through different sections of the forensic blog collection:
Happy timeline building — Good Hunting!