A Step-by-Step Walkthrough: Analyzing a SolarMarker-Infected Memory Dump

Disclaimer


This guide is purely for educational and personal reference. Every technique, plugin, and insight comes directly from the SANS GCFA training I just finished. I'm walking through a real SolarMarker memory sample (solarmarker.img) so you can follow along, understand the "why" behind every step, and see how the pieces fit together. All credit to SANS — their training is phenomenal.
What We're Looking At

We have a memory image from a Windows 10 machine that got hit by SolarMarker (also called Jupyter or Yellow Cockatoo).
This malware is sneaky: it's a .NET infostealer that grabs autofill data, saved passwords, and credit cards from browsers, plus it can download more files and run commands from its C2 server.
The infection chain starts with a big fake "flash_installer.msi", drops PowerShell scripts, creates a weird random folder full of encrypted junk, and plants a .lnk in the Startup folder for persistence.
Great background reads: Cybereason Solarmarker article, Palo Alto Unit 42 SolarMarker article
Tools I Used
- Volatility 3 (running on SIFT Linux) — super granular, perfect for digging into specific structures.
- Volatility 2 (a couple plugins still work better here).
- MemProcFS (on Windows SIFT) — my favorite for this case because it mounts the entire memory dump as a normal drive (M:) and gives you every artifact in one folder structure. Run it once and you're done.

Why Memory Analysis Matters
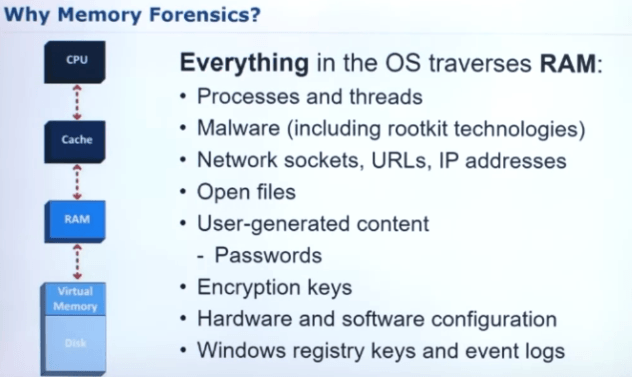
Everything that happens on a computer touches memory: running processes, threads, network connections, open files, passwords, encryption keys, registry values — even things that were deleted from disk. If you only look at the hard drive, you miss the full story. Memory shows you what was actually executing right when the snapshot was taken.
The Standard Analysis Flow We'll Follow
- Profile the system (know what OS and kernel we're dealing with)
- Find rogue processes
- Dig into those processes objects (DLLs, command lines, tokens, handles)
- Check network activity
- Look for code injection / anomalies
- Audit drivers / Rootkit detection
- Dump anything suspicious
Quick Windows Memory 101
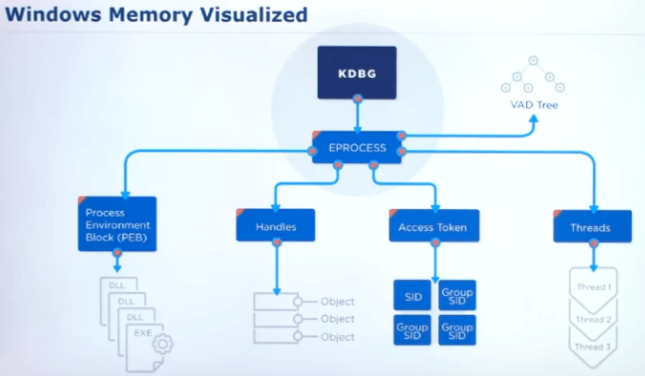
Think of memory like a big linked list:
- KDBG is the starting point — the kernel debugger block that points to every active process.
- EPROCESS blocks are chained together like a linked list. Each block represents one running process (PID, creation time, threads, etc.).
- VAD Tree tells you what's actually loaded in that process's memory (code sections, heap, mapped files).
- PEB is the process's own "ID card" — it lists loaded DLLs and the exact command line that was used to start it.
- Handles show every file, registry key, or socket the process is touching.
- Access Tokens tell you who the process is running as (SYSTEM vs. domain user).
- Threads are the actual lines of code executing right now.
Analyst mental model I always use:
EPROCESS
├── PEB     → "What the process claims is loaded"
├── VAD     → "What is really in memory"
├── Handles → "What it's touching"
├── Token   → "Who it's running as"
└── Threads → "What is actually executing"

Identity  → EPROCESS
Intent    → Command line (PEB)
Execution → Threads + VAD
Access    → Handles
Authority → Token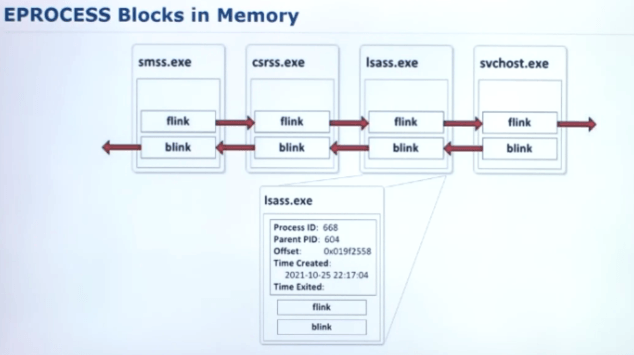
Analysis Steps
Step 1: Profile the System
Why this matters
Profiling the system is the very first step because it tells Volatility exactly how to interpret the memory image. Memory layouts, kernel structures, and offsets can vary between Windows versions and builds. Without the correct profile, all subsequent analysis could be inaccurate or even completely misleading.
Additionally, taking note of the system timestamp and other environment details helps us begin building a timeline of activity. This context is crucial when correlating suspicious processes, network connections, or artifacts to specific points in time during an investigation.
I always start here so Volatility knows exactly which symbols and offsets to use.
# Step 1: Check the memory image info
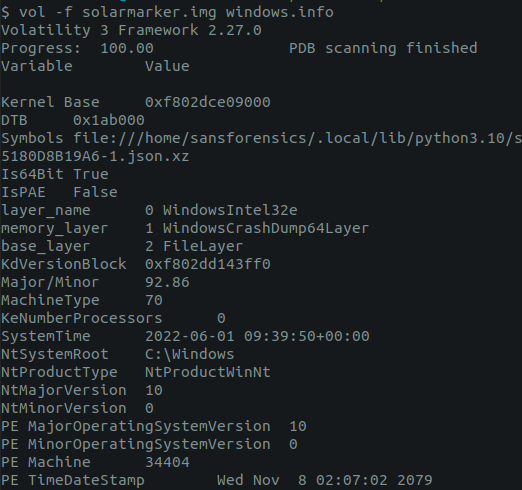
vol -f solarmarker.img windows.info

# Step 2: Based on output, set profile (Volatility 2 example)
vol -f solarmarker.img --profile=Win10x64_19041 pslist
We get: Windows 10 x64, build details, Kernel Base address, DTB, system time (2022-06-01 09:39:50 UTC), etc.
Step 2: Identify Rogue Processes
Why this matters
Identifying rogue processes is a critical first step in memory analysis because processes represent the active execution layer of an attack. By analyzing what is running (and what may have recently run), we can begin to uncover how an attacker gained execution, escalated privileges, and moved within the system.
Many attack techniques—such as fileless malware, living-off-the-land binaries (LOLBins), and process injection—rely on abusing legitimate processes to blend in with normal system activity.
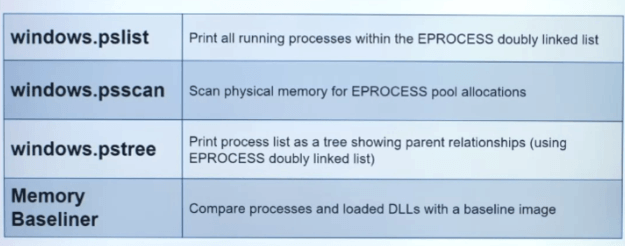
windows.pslist (running processes) + windows.psscan (scans for terminated/hidden processes) + Volatility 2 pstree for the tree view.
When reviewing the results, look for anomalies such as:
- Unusual or unexpected process names
- Processes running from suspicious locations
- Duplicate or misspelled system process names
- Processes with abnormal parent-child relationships
- Recently terminated processes that appear suspicious
IOCs noted:
- services.exe → svchost.exe → msiexec.exe (PID 5340, SYSTEM)
- msiexec (5340) → msiexec.exe (PID 6872, now domain user)
- msiexec (6872) → powershell.exe (PID 5352) + conhost.exe (PID 6388)
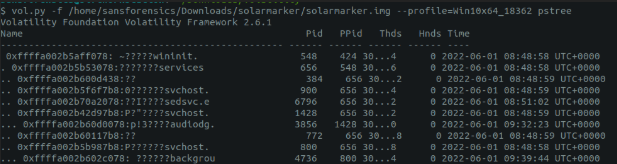

Classic red flag: msiexec spawning PowerShell + privilege context switch.
Step 3: Analyze Process Objects
In this step, we aim to build context around previously identified Indicators of Compromise (IOCs) while also looking for potential signs of additional IOCs.
To do this, we will examine several key details:
- Associated DLLs: Identify dynamic link libraries loaded by the process, as these can reveal malicious behavior or relationships with other compromised components.
- Command Line Arguments: Review the command-line arguments used by the process to uncover potentially suspicious flags, payloads, or obfuscation techniques.
- Security Content: Assess what security content the process is interacting with, which could provide insights into the attack's evasion tactics.
- Handles/Objects Accessed: Look into the handles or objects the process is interacting with (files, registry keys, network connections, etc.).
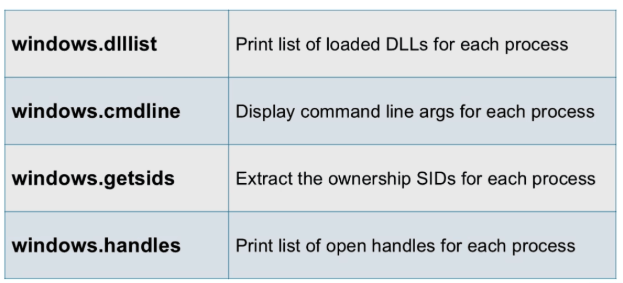
The first thing we'll examine is windows.cmdline, as this is relevant to the IOC we're investigating.
Unfortunately, there were no command-line arguments observed for the PowerShell or conhost processes, nor did we see any relevant output from the dlllist plugin.

Next, we need to examine the security context in which the PowerShell and conhost processes were running. Both processes are running as a domain user, which, depending on the user, may not be out of the ordinary. However, what stands out is the parent process—it appears that powershell and conhost were both spawned by msiexec.exe and subsequently by services.exe.
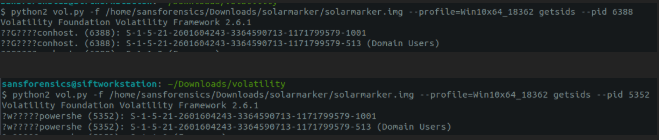

IOCs Noted: We see the suspicious process chain (6872,5340,5352,6388) running under security context of a domain user S-1-5-21-2601604243-3364590713-1171799579-1001
Step 4: Review Network Objects
Here, we have two main plugins for examining network connections. Netstat displays all currently allocated and active connections that are still present. Netscan, on the other hand, scans memory to identify remnants of ended or unallocated connections.

By using both tools together, we can build a clearer picture of whether processes were communicating with external systems.
When reviewing the results, look for anomalies such as:
- Unusual or unexpected external IP addresses (especially rare, foreign, or known malicious ranges)
- Connections to suspicious or uncommon ports
- Processes that should not normally communicate over the network (e.g., lsass.exe, winlogon.exe)
- Multiple outbound connections from a single process to different IPs (possible C2 beaconing)
- Repeated connections to the same external IP (potential command-and-control communication)
- Short-lived or rapidly opening/closing connections (beaconing, failed callbacks, or scanning activity)
- Network activity from previously identified suspicious processes or IOCs
- Listening ports opened by suspicious or unknown processes
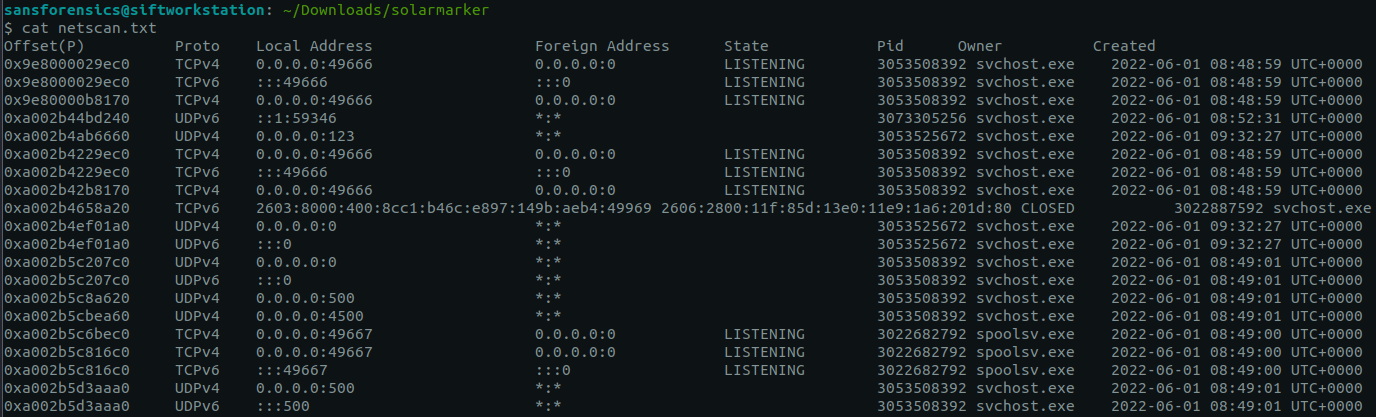
Here, we see the output from Netscan. There are no connections tied to our previous IOC chain. However, we do observe three external closed connections, all using IPv6. None have enough evidence to be labeled as having a bad reputation.
Step 5: Look for Code Injection
What is Code Injection? At its core code injection aims to execute malicious code in a target "victim" process.
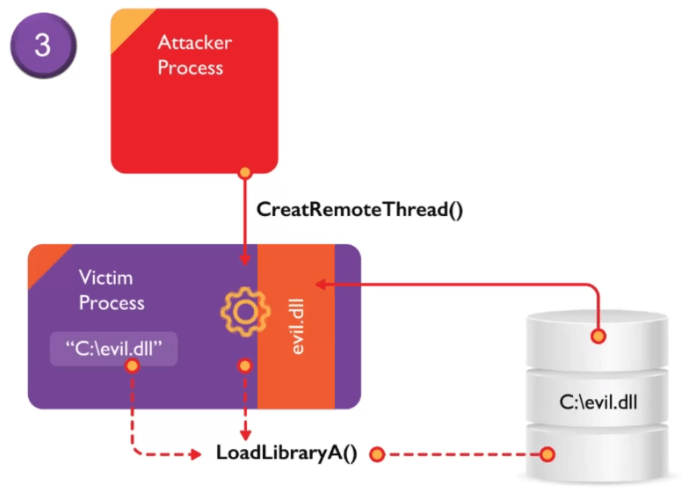
Common Code Injection Types:
- Simple DLL Injection — Write a DLL path into remote process → force it to call LoadLibrary(path) via remote thread. Leaves obvious artifacts (disk file + loaded module list).
- Reflective DLL Injection — Write entire DLL binary into remote process → remote thread jumps to custom ReflectiveLoader export → DLL manually maps/fixes/loads itself (no LoadLibrary needed). Popular because it's fileless.
- Process Hollowing — Create legit process suspended → gut/hollow its original code → write full malicious EXE → fix headers/PEB/context → resume thread. Makes malicious code appear as the legitimate program.
| Aspect | Simple DLL Injection | Reflective DLL Injection | Process Hollowing |
|---|---|---|---|
| Writes to disk? | Yes | No — fileless | No — fileless |
| Evasion strength | Low | Good | Good |
| MITRE ATT&CK | T1055.001 | T1055.001 | T1055.012 |
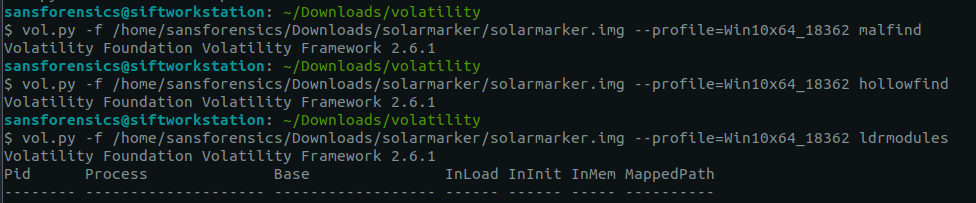
Here, we focus on two powerful Volatility plugins: windows.ldrmodules and windows.malfind.
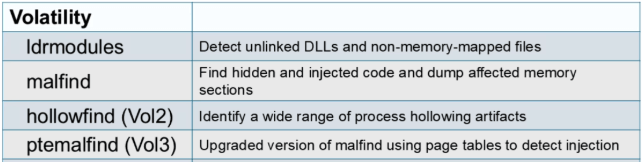
windows.ldrmodules compares the three PEB loader lists (InLoad, InMemory, InInit) to detect unlinked/hidden DLLs.
windows.malfind scans process memory for suspicious regions that are marked executable (RWX), not backed by a file on disk, and often containing MZ/PE headers or shellcode patterns.
Unfortunately for us Volatility did not show any results for either module. It happens and the reason why we use multiple tools and techniques.

Step 6: Audit Drivers
The next step is to focus on the drivers loaded into the system. Drivers are critical system components that run in kernel mode and can be exploited by attackers to maintain persistence, escalate privileges, or execute arbitrary code.
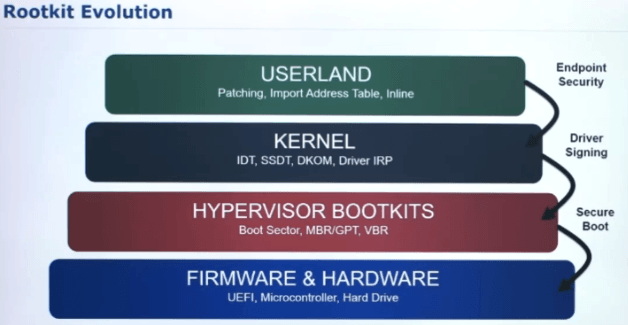
Key Artifacts to Review:
- Driver Names and File Paths: Suspicious or unusual driver names can indicate the presence of malware.
- Driver Memory Locations: A driver loaded into unexpected memory ranges could be indicative of manipulation.
- Driver Signed Status: Drivers that are unsigned or have invalid signatures may be malicious.
- Process Creation from Drivers: Investigating any processes that were created by drivers can uncover covert attacks.
Sample Commands (Volatility 3)
# Check SSDT for hooks (kernel system call redirection)
vol -f solarmarker.img windows.ssdt

# Identify IRP hooks in drivers
vol -f solarmarker.img windows.driverirp

# Cross-view hidden processes
vol -f solarmarker.img windows.psxview

# List loaded kernel modules/drivers
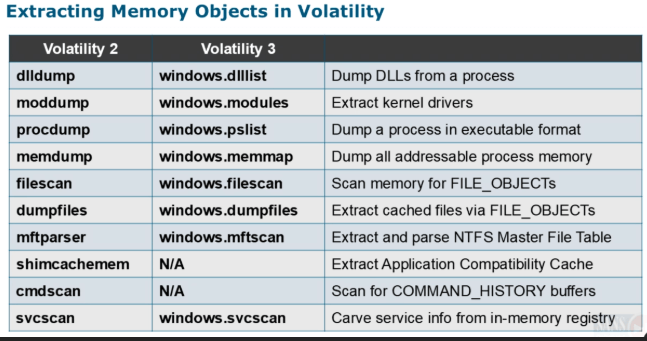
vol -f solarmarker.img windows.modules

# Scan for hidden/unlinked drivers via pool tags
vol -f solarmarker.img windows.modscan

# Detect drivers specifically hidden by rootkit techniques
vol -f solarmarker.img windows.drivermodule
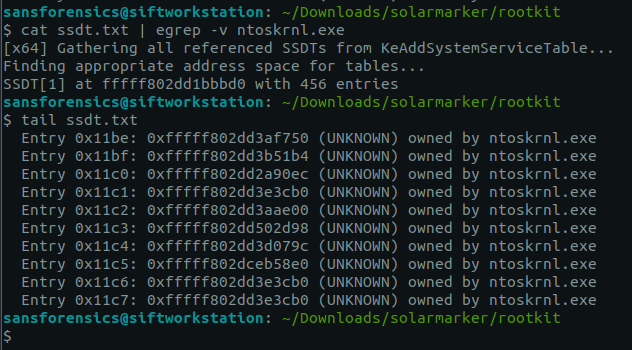
Here we see output of ssdt plugin ran on memory. In Windows there are two options commonly seen in this table: ntoskrnl.exe and win32k.sys. If any others are found they are sure a sign of investigation.
Next up was the modules plugin. The vast majority of drivers are loaded from \systemroot\system32\drivers\* which allows us to filter out this location to identify anomalies.

Step 7: Dump Suspicious Artifacts
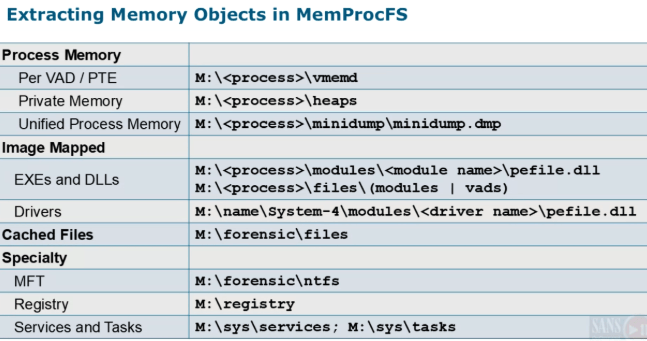
Once we've identified suspicious artifacts, the next step is to extract them from the larger memory sample and perform in-depth analysis. This can include techniques such as static code analysis.
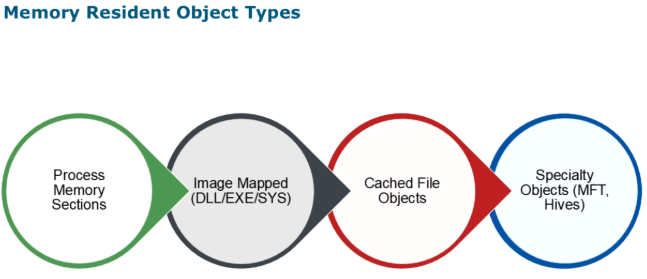
There are four main types of artifacts we can extract:
- Process Memory Sections: Useful for examining the raw data in memory, including hex and ASCII representations.
- Image-Mapped Files (DLL/EXE/SYS): Critical for determining code intent and identifying malicious IOCs within binaries.
- Cached File Objects: These may include files or objects accessed by a malicious process.
- Specialized Objects (MFT, Registry Hives): Useful for correlating file activity through MFT entries or extracting registry data.
MemProcFS — The All-in-One View
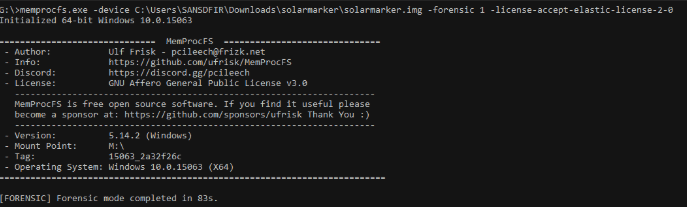
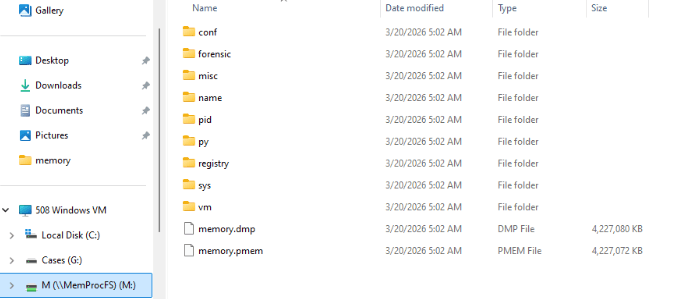
Moving on to MemProcFS, this tool works differently from Volatility. Instead of running individual plugins, MemProcFS processes the entire memory image and mounts the results to a virtual file system (typically the M: drive). You'll see output similar to Volatility plugins but in a single, unified view.
Initial Pivot Points
When exploring MemProcFS output, the first place to look is:
\forensics\findevil.txtThis file combines outputs from multiple plugins and signature-based checks to highlight suspicious anomalies.

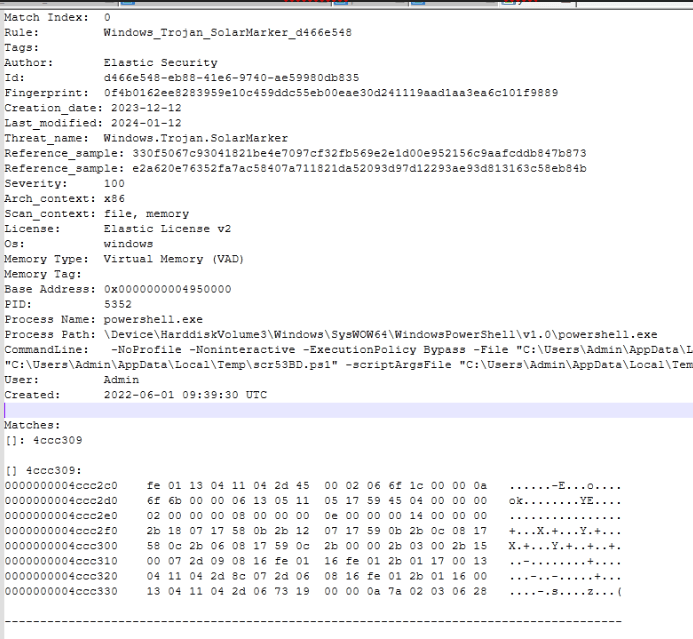
Immediately, we see an indicator for a previously identified PowerShell process associated with SolarMarker.

YARA Matches
Another useful file in the same folder is:
yara.txtThis file runs processes in memory against YARA rules and outputs matches.
Opening yara.txt shows alerts for a suspicious PowerShell process (PID 5352) — four alerts: two for SolarMarker and two for Deimos.
Reconstructing Files
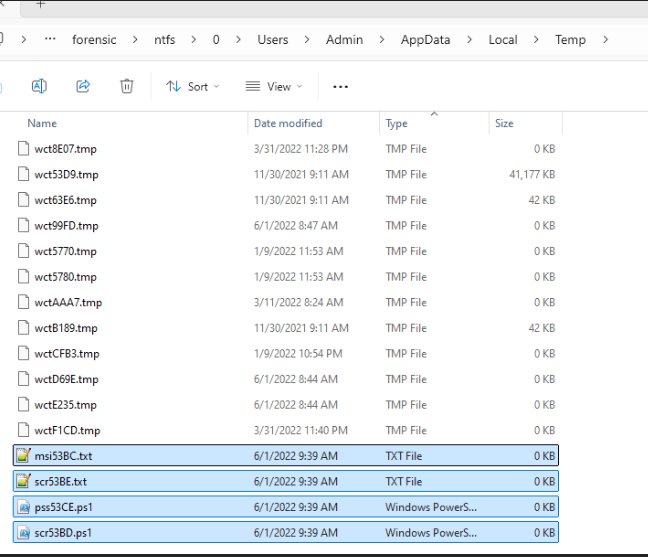
With filenames in hand, we can examine what the scripts are doing. Inside the Forensics folder, navigate to:
\ntfs\This represents the reconstructed file system captured from memory.
Timeline Artifacts
Timestamps are key for building a timeline. The complete timeline can be found in:
/forensics/timeline/timeline_all.txt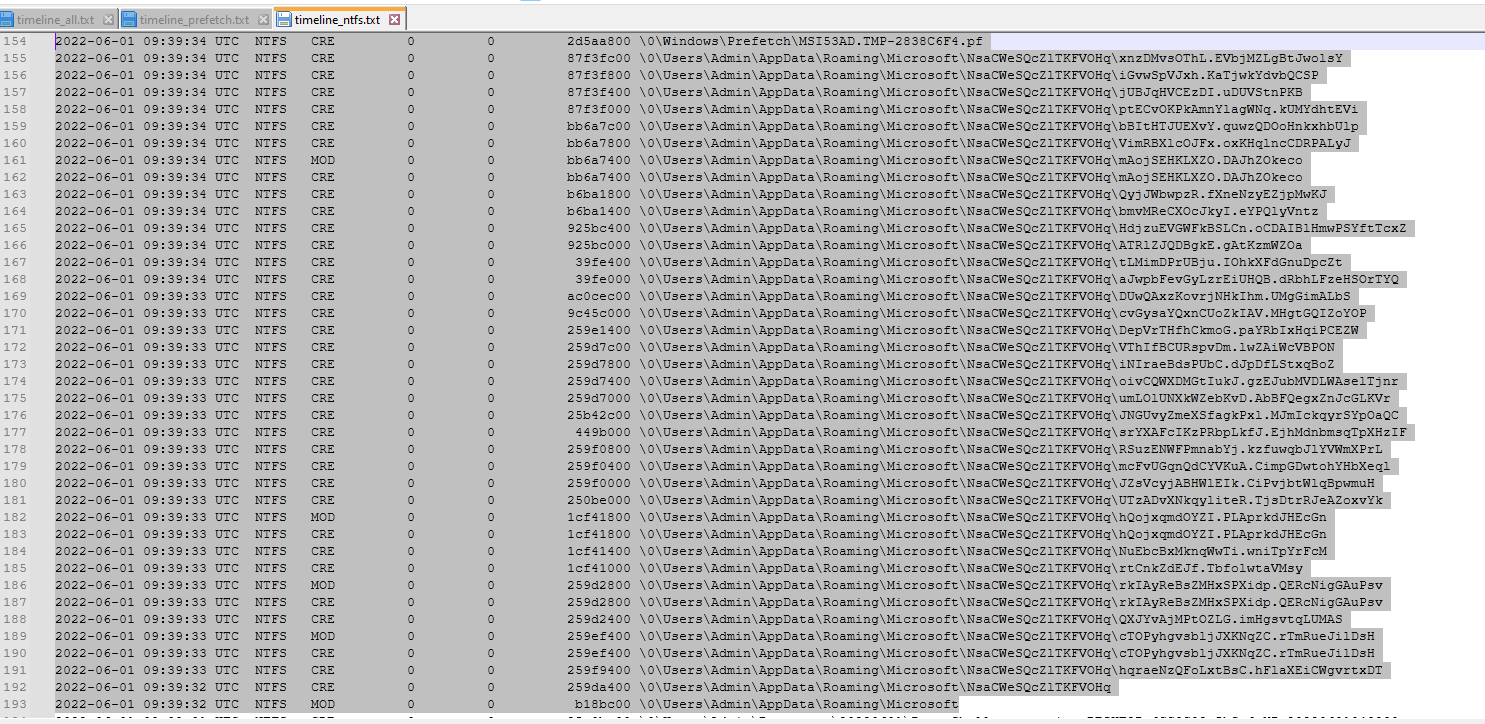
Prefetch files indicate execution of msiexec.exe and powershell.exe. We see a .lnk file created after execution of powershell (known SolarMarker persistence TTP) and a lot of random string value files being created.
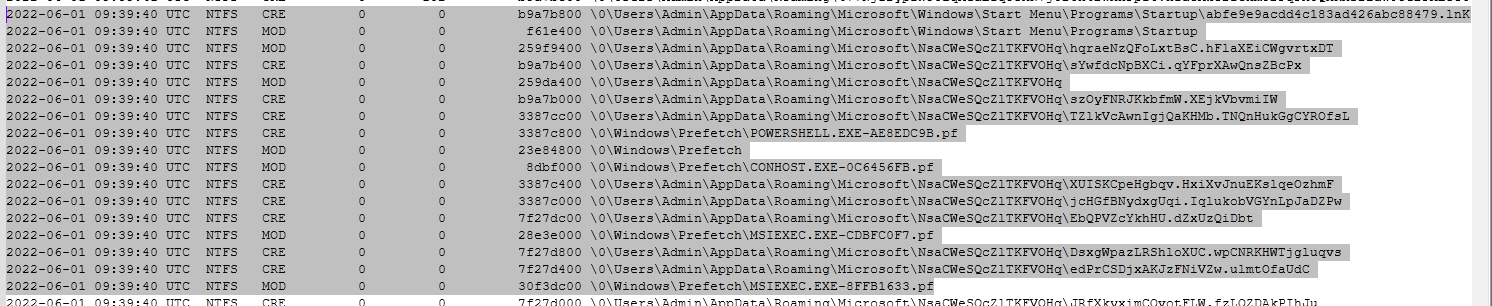
10 seconds prior, we observe what we think are the creation of the PowerShell scripts and temporary folders in:
\Users\Admin\AppData\Local\Temp\*
Lastly if we trace it back to 4 mins prior at (2022-06-01 09:35:05 UTC) we see the file flash_installer.msi which is a known alias for the SolarMarker stager.

Next Steps
Now that we have a pivot point with SolarMarker, we can research its behavior on a system. This provides a roadmap for identifying confirmation factors and determining whether an alert is a true positive.
The Timeline — This Is Where It All Comes Together
From \forensics\timeline\timeline_all.txt:
- 09:35:05 UTC — flash_installer.msi created & executed
- 09:39:30 UTC — PowerShell scripts dropped
- 09:39:38–09:39:40 UTC — Random folder created:
C:\Users\Admin\AppData\Roaming\Microsoft\NsaCWeSQcZlTKFVOHq\ - 09:39:40 UTC — Persistence:
abfe9e9acdd4c183ad426abc88479.lnkin Startup
Pivoting from Memory to Disk: Confirming Everything
- Persistence: Check Startup folder for
abfe9e9acdd4c183ad426abc88479.lnk - Staging Folder:
C:\Users\Admin\AppData\Roaming\Microsoft\NsaCWeSQcZlTKFVOHq\— dozens of gibberish files - Dropper:
C:\Windows\flash_installer.msi - Temp Scripts:
C:\Users\Admin\AppData\Local\Temp\pss*.ps1etc. - PowerShell Evidence: Transcript in Documents + Operational.evtx
- Prefetch: FLASH_INSTALLER.MSI-*.pf, POWERSHELL.EXE-*.pf, etc.
Quick IOC Cheat Sheet
- Folder:
%AppData%\Roaming\Microsoft\NsaCWeSQcZlTKFVOHq\ - LNK:
abfe9e9acdd4c183ad426abc88479.lnkin Startup - MSI:
flash_installer.msiin \Windows\ - Temp:
pss*.ps1,Pro*.tmpin \Temp\ - Transcript: Documents\PowerShell_transcript.*.txt
Closing Thoughts
This was a perfect example of why you never rely on just one tool. Volatility gave the process chain and tokens; MemProcFS gave the timeline, filenames, and random folder that sealed the deal.
Memory analysis feels like detective work: start with one suspicious PowerShell, follow the breadcrumbs, and the entire infection story appears.
If you have the full disk image too, hunt that random folder and the .lnk — they'll still be there.
Forensics Blog Collection
Quickly navigate through the full forensic blog collection: