1. Overview
This guide covers setting up the Elastic Stack (Elasticsearch and Kibana) locally using Docker, configuring it for network access, setting up Fleet for agent management, installing Elastic Agents, and integrating system and Zeek logs. It's ideal for building a home lab SIEM or testing log ingestion pipelines. We'll use scripts and commands to get everything running quickly, including data views and dashboards for visualization.
- Objective: Install and configure Elastic Stack for local log collection, including system and Zeek integrations via Fleet agents.
- Skills Developed: Docker setup, Elastic configuration, Fleet management, agent enrollment, log integration, and Kibana data views.
- Platform: Ubuntu (or similar Linux), Docker, Elastic Stack.
2. Resources Used
Here are the key resources and tools referenced in this setup:
-
Resource:
Title: Docker Installation Guide
Usage: Install Docker and Docker Compose on Ubuntu. -
Resource:
Title: Elastic Local Quickstart
Usage: Official guide for running Elastic Stack locally with a script. -
Resource:
Title: Elastic Agent Download
Usage: Download the Elastic Agent for your OS and Elastic version.
3. Step-by-Step Setup
Here's a detailed breakdown of the installation and configuration process.
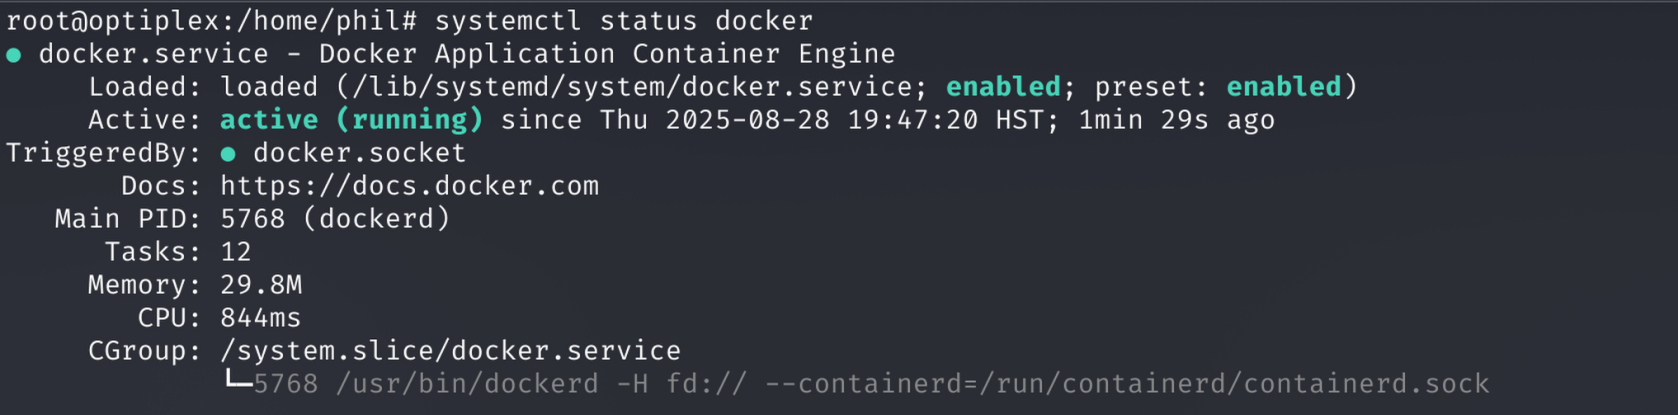
Step 1: Prerequisites
Ensure Docker is installed on OS. I will be using Debain 12 in this writeup. Also, install Docker Compose if not already present.
Commands:
sudo apt-get install docker-composeWhy: Docker is required to run Elasticsearch and Kibana containers. Follow the linked guide for full Docker installation.
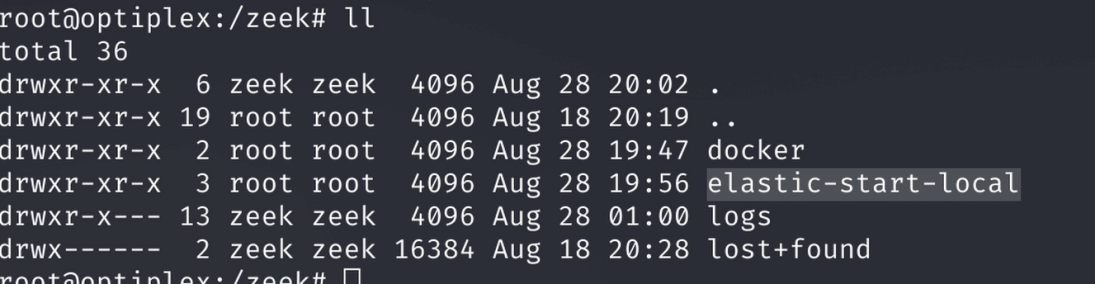
Step 2: Run the Elastic Setup Script
Use the Elastic quickstart script to set up Elasticsearch and Kibana locally.
Command:
curl -fsSL https://elastic.co/start-local | sh
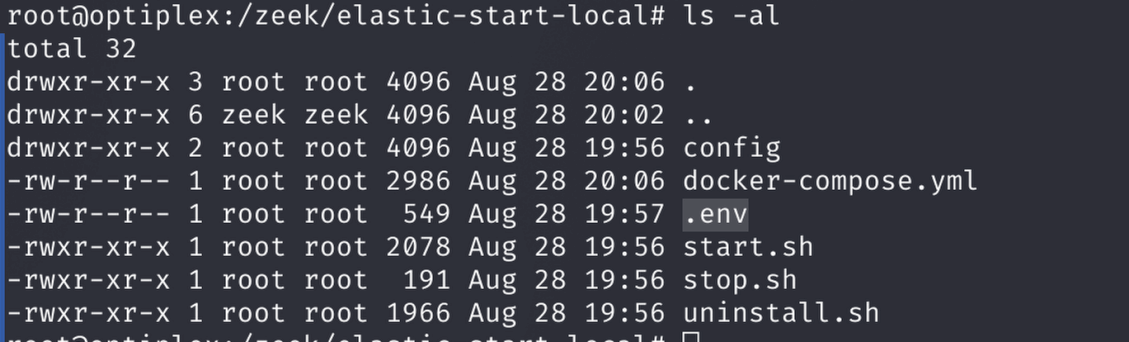
Why: This script automates the creation of a Docker Compose setup for Elastic Stack. Watch for errors and wait for completion. It creates a directory like 'elastic-start-local'.
.png)

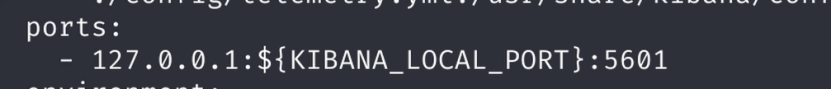
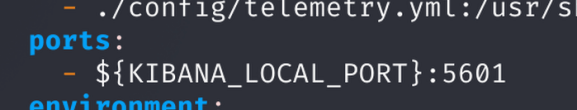
Step 3: Edit docker-compose.yml for Network Access
Modify the Kibana ports in docker-compose.yml to allow access from any IP on the LAN.
Change:
From:
ports:
      - 127.0.0.1:${KIBANA_LOCAL_PORT}:5601
To:
ports:
      - ${KIBANA_LOCAL_PORT}:5601
Why: By default, Kibana is bound to localhost. This change exposes it to the network for access from other devices.
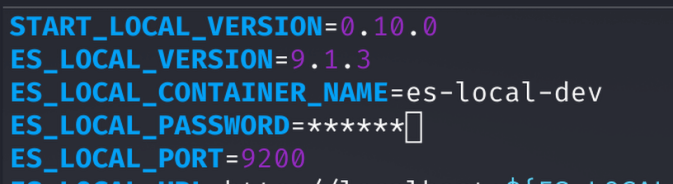
Step 4: Change Default Password
Edit the .env file in the elastic-start-local directory to set a new Kibana password.
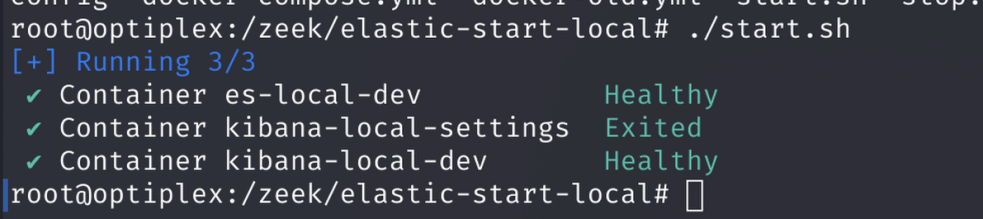
Command:
./start.shWhy: The .env file stores variables like passwords. Updating it secures your setup. Then, restart with start.sh and access Kibana at https://<docker-device-ip>:5601.
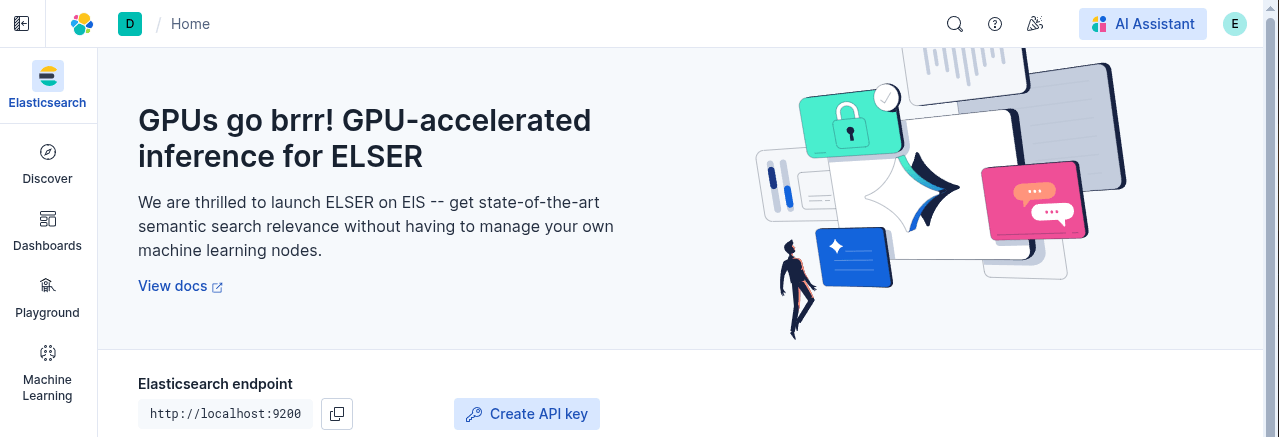
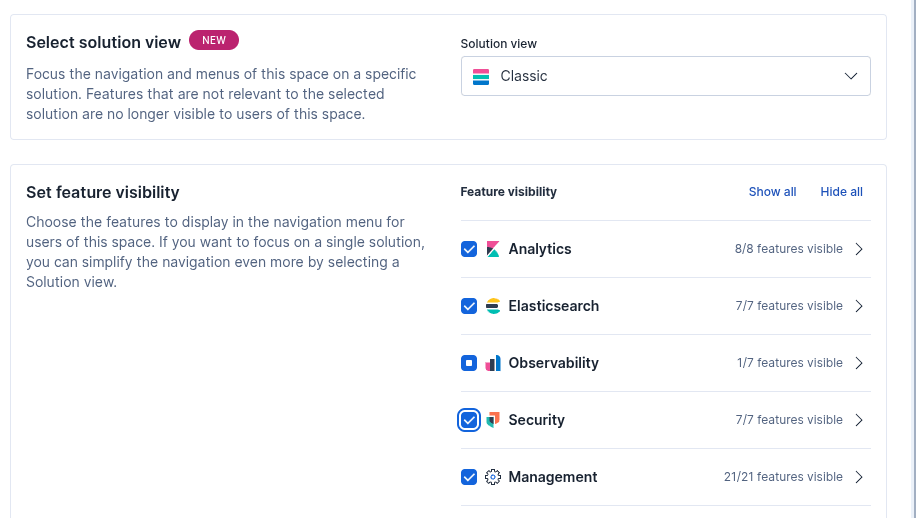
Step 5: Change New Workspace to Classic Mode
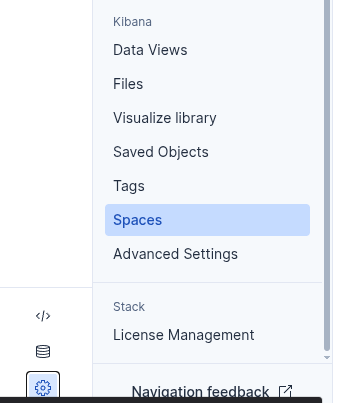
Once logged in, select the settings icon on the bottom left and select "spaces".
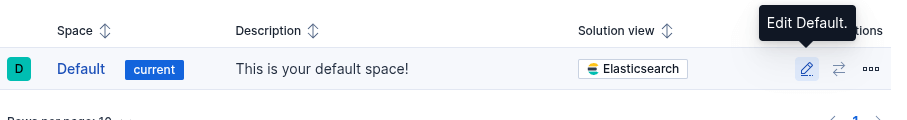
Once in spaces edit default, and select Classic Solution View, and select all features below.
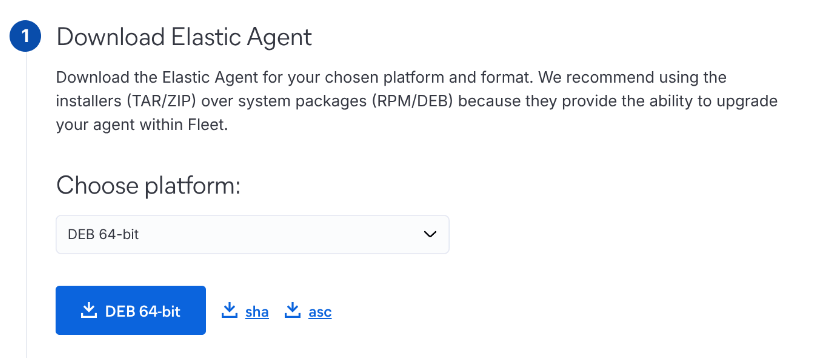
Step 6: Download Elastic Agent
Download the Elastic Agent for your OS and Elastic version.
Why: The agent collects system logs and integrates with other tools like Zeek. Choose the appropriate package (e.g., for Debian).
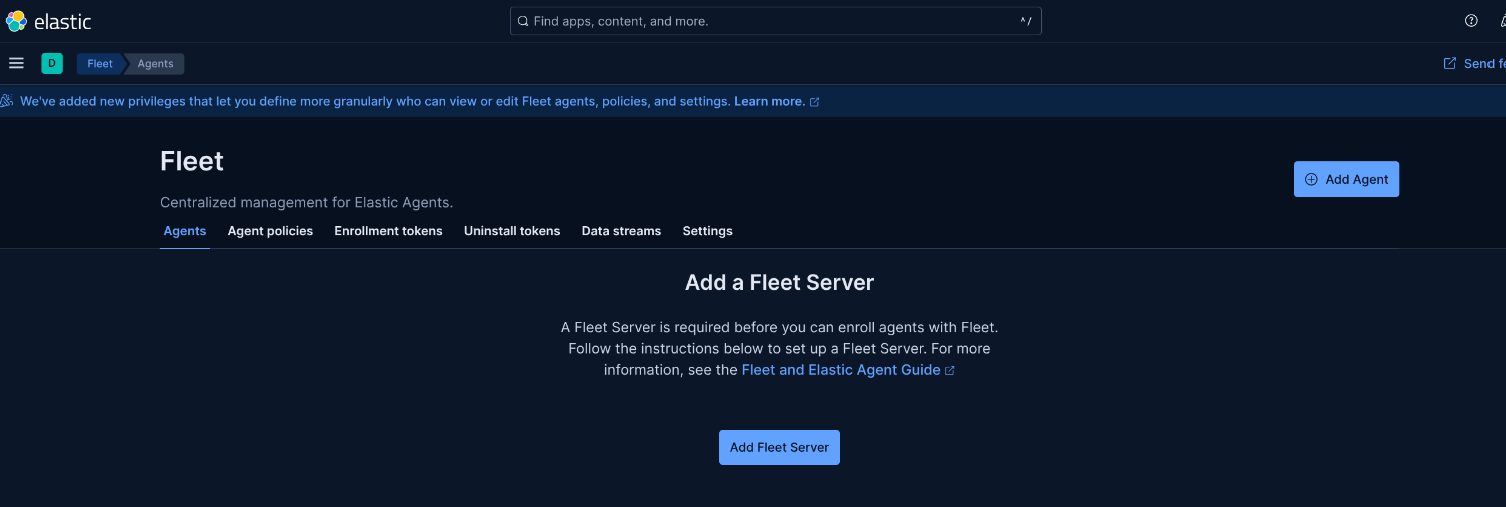
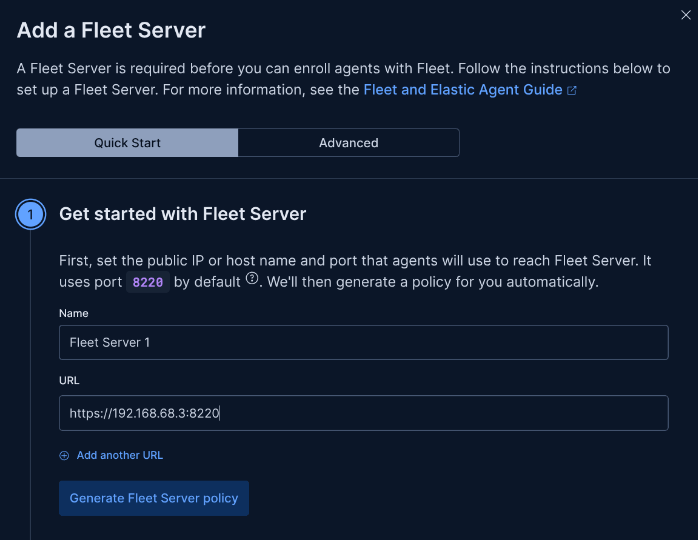
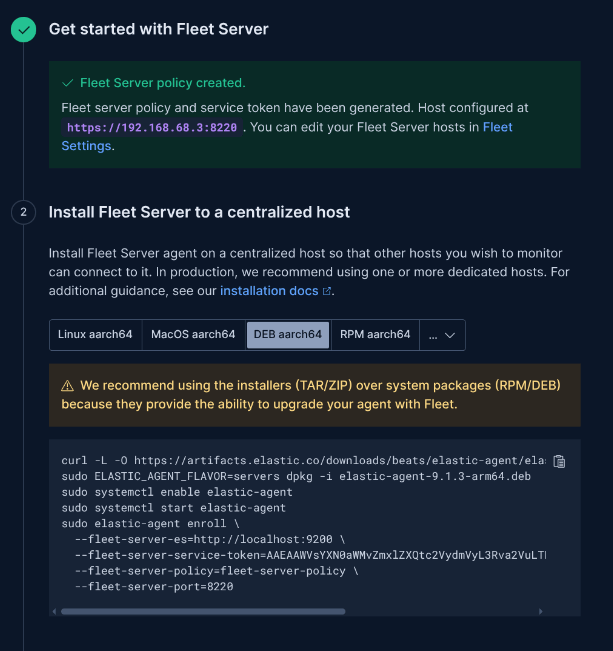
Step 7: Set Up Fleet Server Policy
In Kibana, create a Fleet server policy using the quick start option.
Steps: Choose a name and add the IP of the device to act as the Fleet server (e.g., the Debian server running Elastic).
Why: Fleet manages agents centrally. Using the same device simplifies the setup for a local lab.
Step 8: Install and Enroll Elastic Agent
Install the agent package and enroll it with Fleet.
Commands:
dpkg -i elastic-agent-9.1.3-arm64.deb
    sudo systemctl enable elastic-agent
    sudo systemctl start elastic-agent
    sudo elastic-agent enroll \
      --fleet-server-es=http://localhost:9200 \
      --fleet-server-service-token= \
      --fleet-server-policy=fleet-server-policy \
      --fleet-server-port=8220 --insecure
Why: This installs the agent, enables it on boot, and enrolls it with the Fleet server. You'll see confirmation in the terminal and in Kibana's Fleet UI.

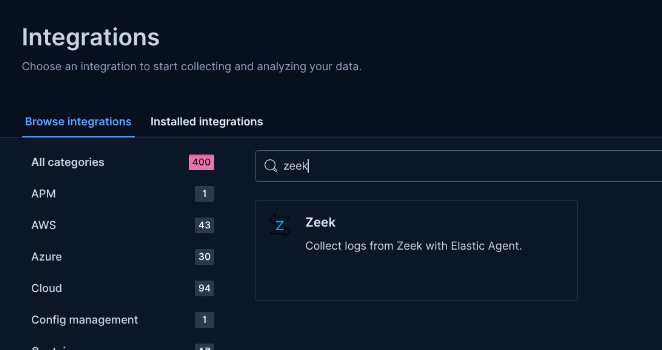
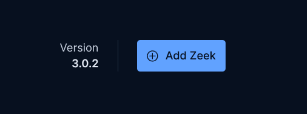
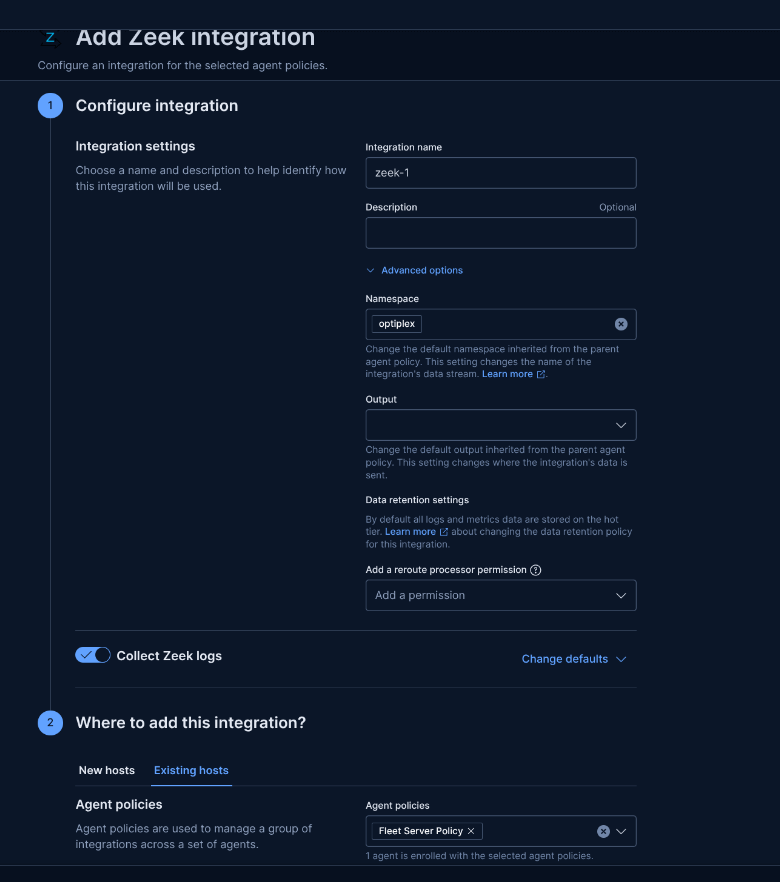
Step 9: Add Integrations
Add integrations for system logs (default) and Zeek.
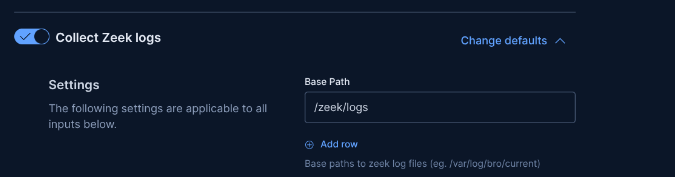
Steps: Go to Management > Integrations, add Zeek, specify log location (e.g., /zeek/logs/current), and apply to the agent policy.
Why: Integrations define what logs to collect. System is added by default; Zeek requires custom log path configuration. Wait 5 minutes for collection to start.
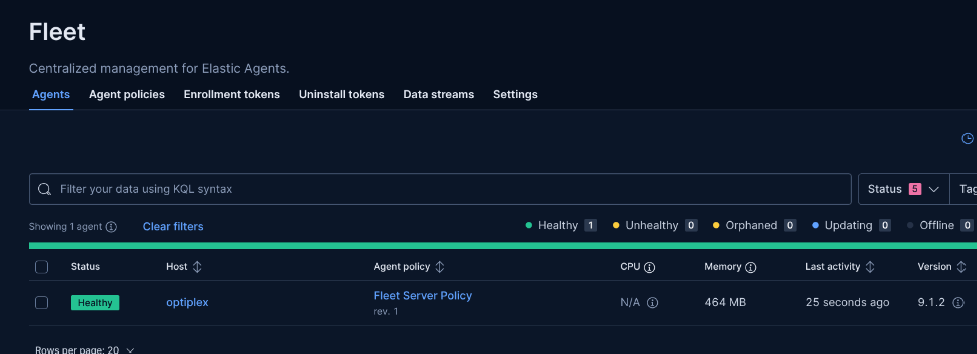
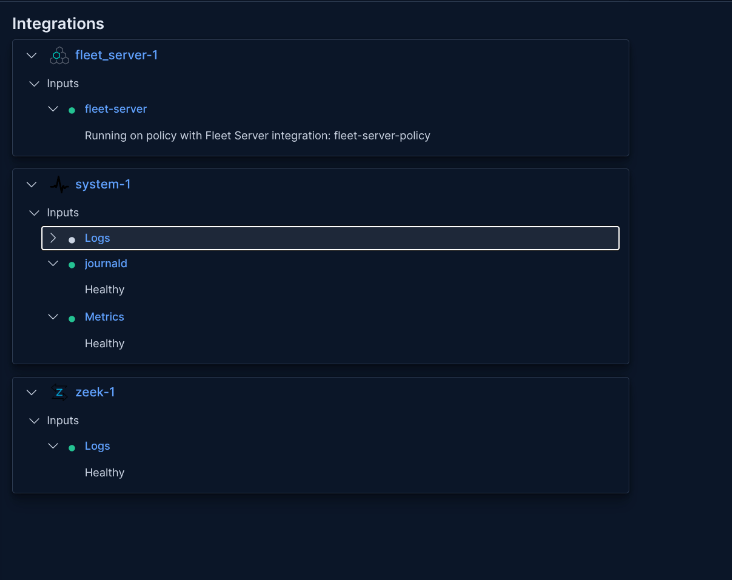
Step 10: Verify Agent Health
Check the agent in Fleet to ensure integrations are healthy.
Why: This confirms logs are being collected without issues. Look for healthy status on the right side of the agent details.
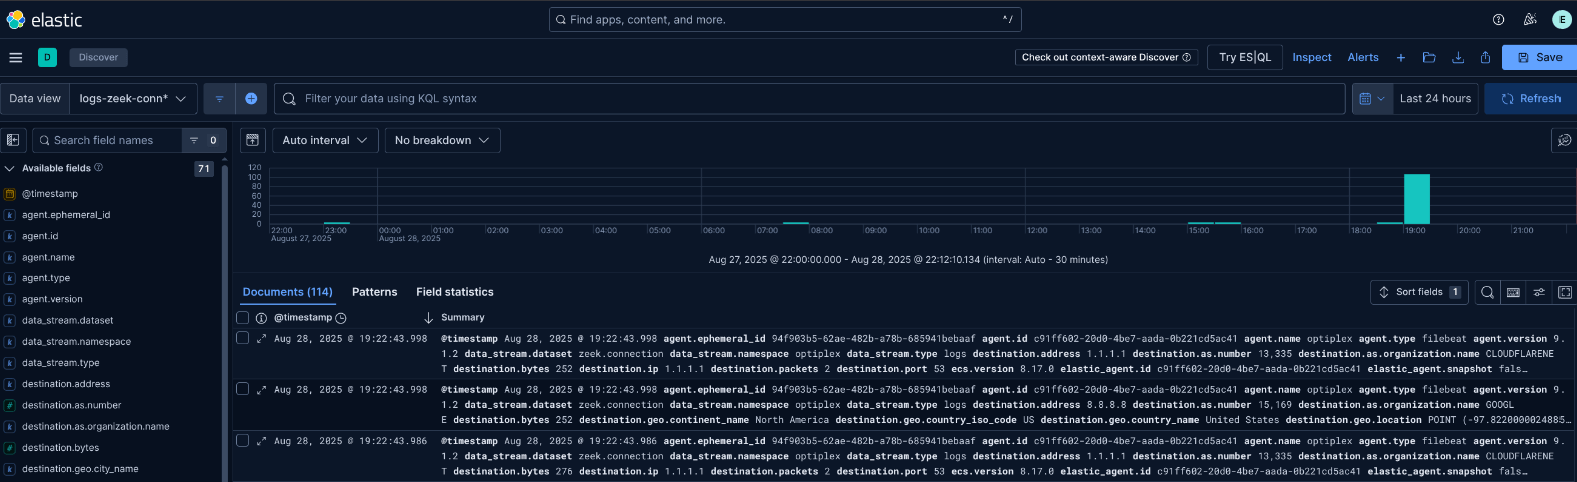
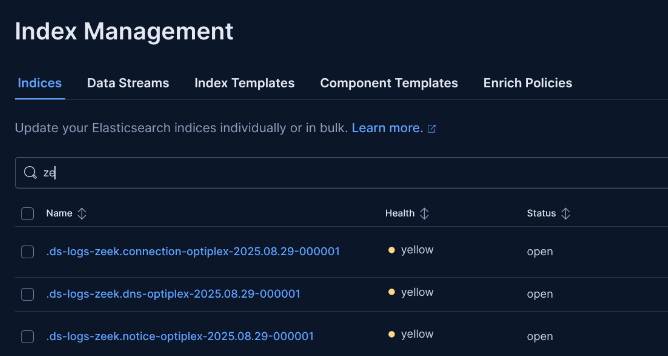
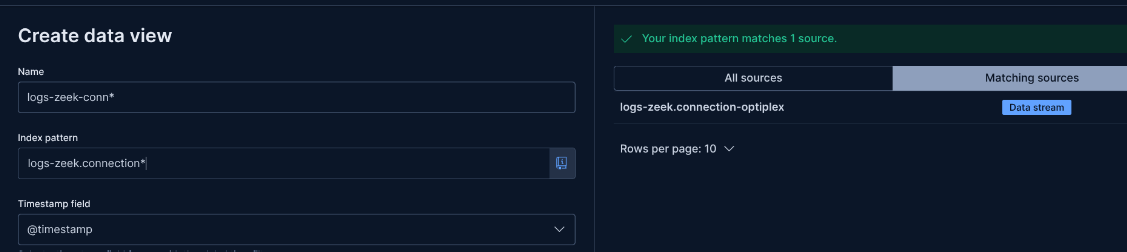
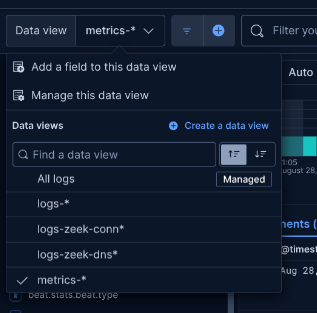
Step 11: Create Data Views for Zeek Datasets
Find the index naming schema in Stack Management > Index Management, then create data views in Kibana.
Example Index Pattern:
logs-zeek-connection*Why: Data views make logs queryable in Discover. Use patterns like .ds-logs-zeek.connection to match Zeek conn logs.
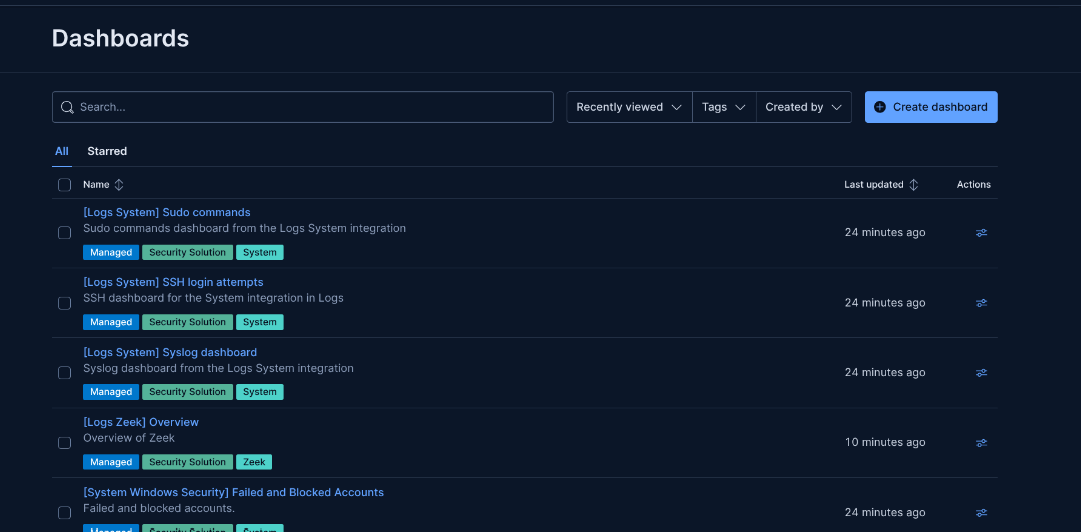
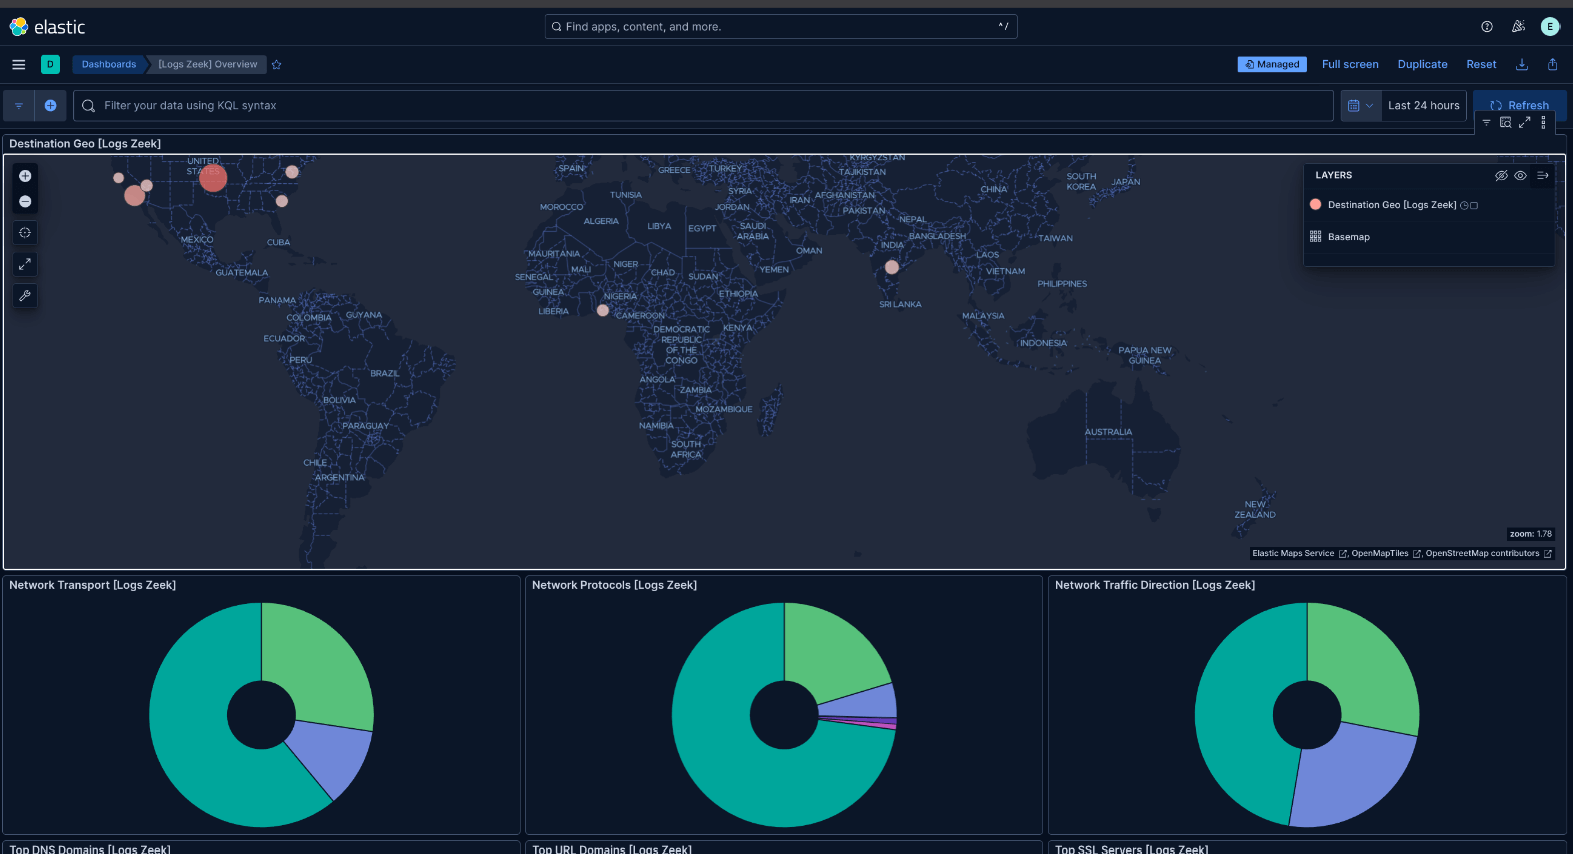
Step 12: Explore Dashboards
Use the default dashboards created by integrations in Kibana.
Why: Dashboards provide visualizations for system and Zeek logs. From here, customize as needed.
4. Lessons Learned and Tips
Key insights from this setup:
- Tip 1: Always check for errors during script execution and container startup. "docker logs imagename" is the cmd.
- Tip 2: Use --insecure for local setups, but enable TLS for production.
- Tip 3: Monitor index growth; allocate sufficient storage for logs.
- Key Lesson: Fleet simplifies agent management, making it easy to scale log collection.
- Future Goals: Integrate more sources like Suricata and explore advanced alerting in Kibana.
5. Conclusion
Setting up the Elastic Stack locally provides a solid foundation for log ingestion and analysis in a home lab. From running the quickstart script to enrolling agents and creating data views, this process gets you ingesting system and Zeek logs quickly. Thanks for following along—now you can customize and expand your setup!
6. Additional Notes
- Secure your setup by changing default passwords and using HTTPS.
- For multi-host setups, adjust Fleet server IPs accordingly.